Fig. 12
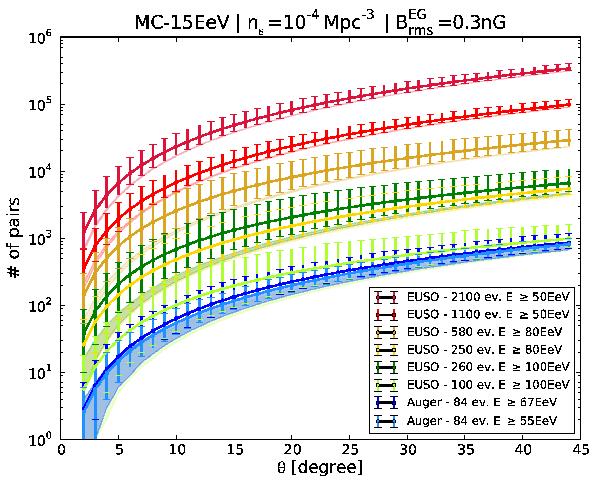
Two-point correlation functions for the MC-15EeV model, with a source density ns = 10-4 Mpc-3 and an intensity of the random EGMF of 0.3 nG (rms). The different statistics for each experiment are shown in different colors, as indicated (light and dark tones of the same color are for the Pierre Auger Observatory and TA energy scales, respectively, see text). The error bars contain 90% of the 500 simulated realizations. Isotropic samples with the same statistics are given as a shaded area of the same color (the envelope contains 90% of the isotropic samples).
Current usage metrics show cumulative count of Article Views (full-text article views including HTML views, PDF and ePub downloads, according to the available data) and Abstracts Views on Vision4Press platform.
Data correspond to usage on the plateform after 2015. The current usage metrics is available 48-96 hours after online publication and is updated daily on week days.
Initial download of the metrics may take a while.