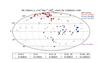
Fig. 11
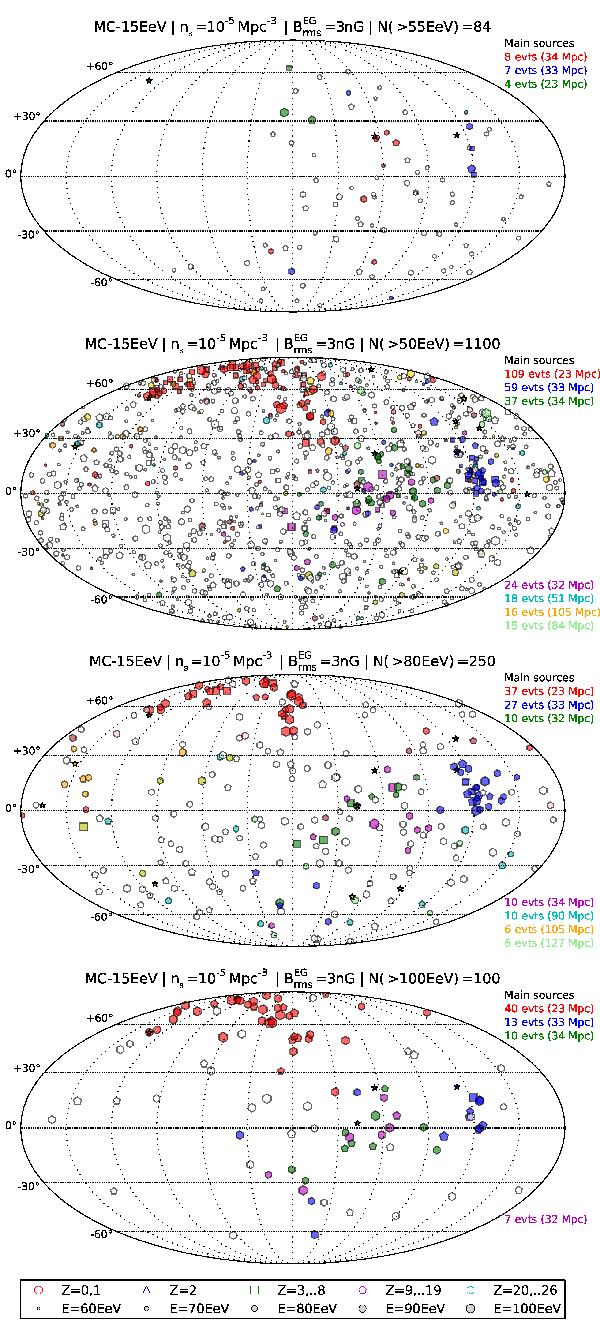
Examples of sky maps corresponding to the MC-15EeV model (see text), simulated for the current statistics of the Pierre Auger Observatory (top panel) and for the expected statistics that JEM-EUSO would gather with a total exposure of 300 000 km2 sr yr, assuming the flux normalization given by the Pierre Auger Observatory energy scale (see text). The second, third, and fourth maps are drawn with a (reconstructed) energy threshold of 50 EeV, 80 EeV, and 100 EeV, respectively.
Current usage metrics show cumulative count of Article Views (full-text article views including HTML views, PDF and ePub downloads, according to the available data) and Abstracts Views on Vision4Press platform.
Data correspond to usage on the plateform after 2015. The current usage metrics is available 48-96 hours after online publication and is updated daily on week days.
Initial download of the metrics may take a while.