Free Access
Fig. 3
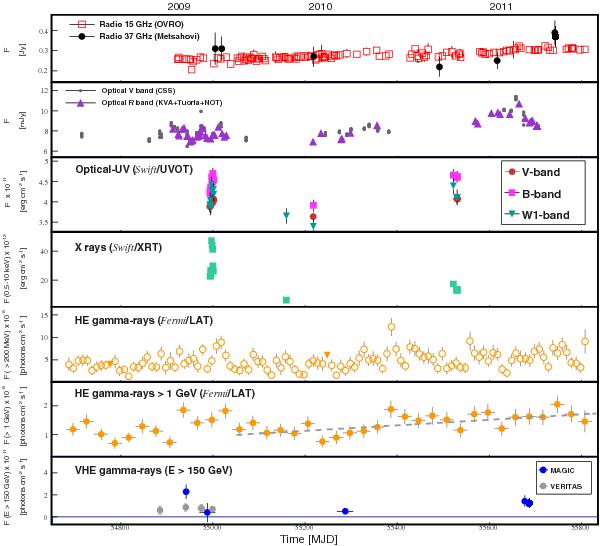
Multiwavelength light curve of PKS 1424+240 from MJD 54 700 to MJD 55 800. Since all Swift/UVOT filter data show the same trend, only filters B,V, and W1 are shown. The dashed gray line represents a linear fit to the Fermi-LAT data after the X-ray flare.
Current usage metrics show cumulative count of Article Views (full-text article views including HTML views, PDF and ePub downloads, according to the available data) and Abstracts Views on Vision4Press platform.
Data correspond to usage on the plateform after 2015. The current usage metrics is available 48-96 hours after online publication and is updated daily on week days.
Initial download of the metrics may take a while.