Free Access
Fig. 1
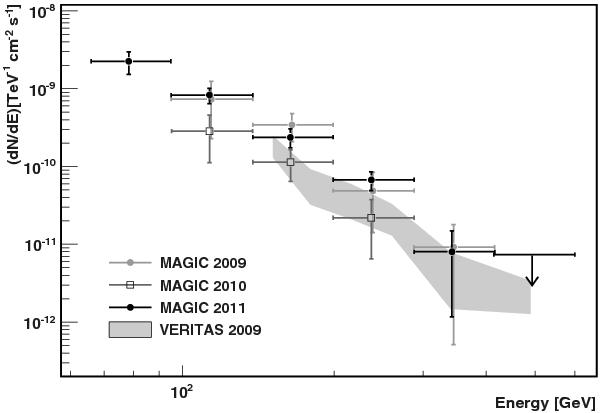
Differential energy spectra of PKS 1424+240 measured by MAGIC in 2009 (gray circles), 2010 (squares), and 2011 (black circles). The black downward arrow represents the 95% confidence level upper limit for 2011 data. The gray-shaded area represents the results obtained in 2009 with VERITAS (Acciari et al. 2010).
Current usage metrics show cumulative count of Article Views (full-text article views including HTML views, PDF and ePub downloads, according to the available data) and Abstracts Views on Vision4Press platform.
Data correspond to usage on the plateform after 2015. The current usage metrics is available 48-96 hours after online publication and is updated daily on week days.
Initial download of the metrics may take a while.