Fig. 5
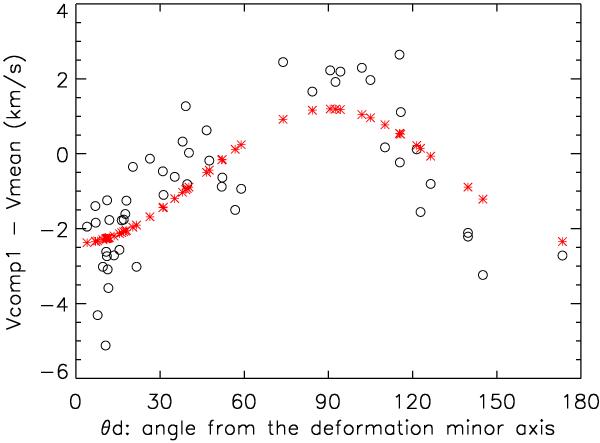
Velocity deviations relative to the mean velocity vector, plotted against the angular distance to our best fit to the cloud’s minor axis [ld = 174.172°, bd = −12.098°]. The data points for Mg II in this plot (open circles) differ only slightly from those shown in Fig. 3 because the deformation axis pointing toward (ld,bd) that defines θd is not far from the apex of motion in the direction (lm,bm) (see Table 1). The red asterisks show the model predictions.
Current usage metrics show cumulative count of Article Views (full-text article views including HTML views, PDF and ePub downloads, according to the available data) and Abstracts Views on Vision4Press platform.
Data correspond to usage on the plateform after 2015. The current usage metrics is available 48-96 hours after online publication and is updated daily on week days.
Initial download of the metrics may take a while.