Fig. 4
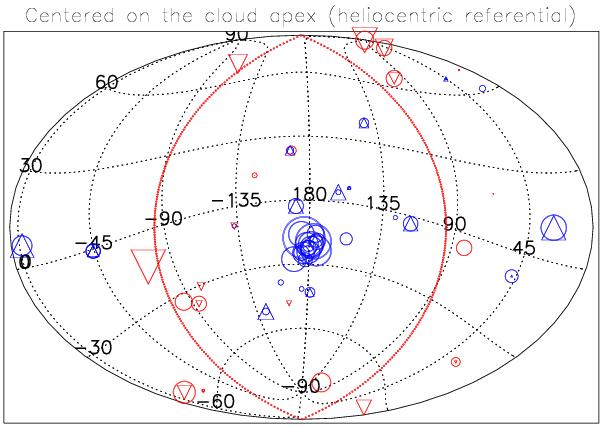
Velocity deviations from the best-fit velocity vector, plotted against Galactic coordinates and centered on the apex of this vector. The red curve represents directions where θm = 90°, i.e., the circle 90° away from the direction of motion. Positive deviations are in red and negative deviations are in blue. The size of the symbols indicates the magnitude of the velocity deviations. Circles: Mg II, triangles: Fe II.
Current usage metrics show cumulative count of Article Views (full-text article views including HTML views, PDF and ePub downloads, according to the available data) and Abstracts Views on Vision4Press platform.
Data correspond to usage on the plateform after 2015. The current usage metrics is available 48-96 hours after online publication and is updated daily on week days.
Initial download of the metrics may take a while.