Fig. 2
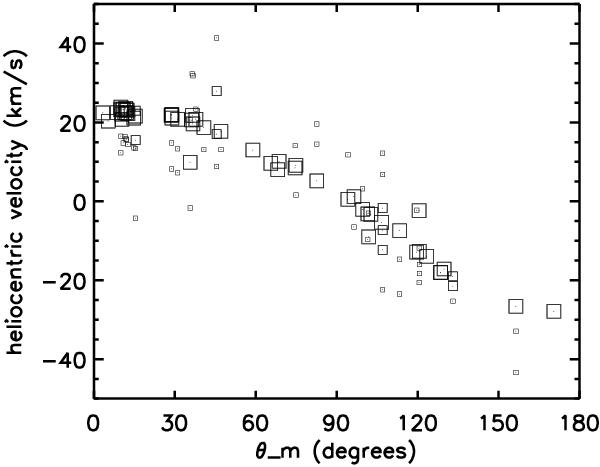
Measured velocities of all components plotted against their corresponding angles θi,m away from the apex of the best-fitting velocity vector for Components 1. Large symbols indicate components that are dominant in their line of sight in terms of column density. Medium-size symbols depict cases where two secondary components in a line of sight have identical column densities within their error bars. The smallest symbols indicate components that are clearly secondary. The adopted reference column densities are those of Fe II, when available, and Mg II otherwise. Note that nearly all the largest symbols are aligned with a curve that we can identify with the overall trend Vmcos θi,m of Components 1, where Vm = 25.53 km s-1.
Current usage metrics show cumulative count of Article Views (full-text article views including HTML views, PDF and ePub downloads, according to the available data) and Abstracts Views on Vision4Press platform.
Data correspond to usage on the plateform after 2015. The current usage metrics is available 48-96 hours after online publication and is updated daily on week days.
Initial download of the metrics may take a while.