Fig. 10
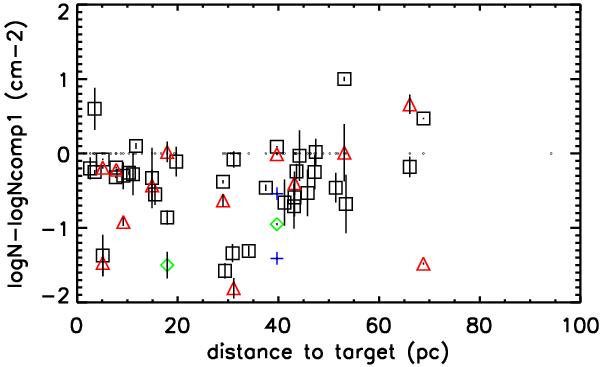
Column density ratios (in log) between the other components and their corresponding Component 1: log N/Ncomp1 against distance. The column density is that of Fe II when available and Mg II otherwise. The dots are components 1. They show the position of all lines of sight. The other components, numbered in order of increasing | ΔV | relative to Component 1 are as follows: black squares are Components 2, red triangles Components 3, green diamonds Components 4 and blue crosses Components 5 and 6.
Current usage metrics show cumulative count of Article Views (full-text article views including HTML views, PDF and ePub downloads, according to the available data) and Abstracts Views on Vision4Press platform.
Data correspond to usage on the plateform after 2015. The current usage metrics is available 48-96 hours after online publication and is updated daily on week days.
Initial download of the metrics may take a while.