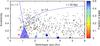
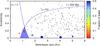
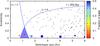
Fig. 4
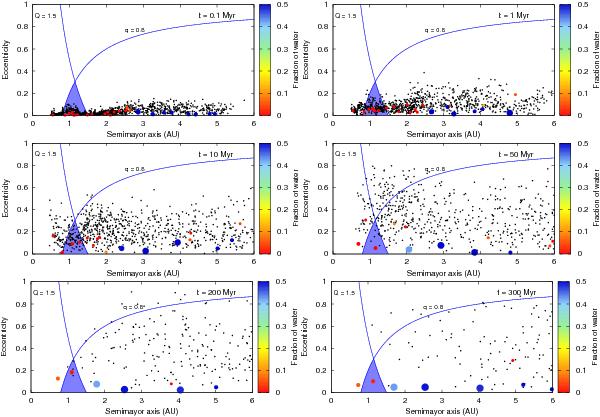
Evolution in time of the S3 simulation for γ = 1. The light-blue shaded area represents the HZ and the curves with q = 0.8 AU and Q = 1.5 AU represent curves of constant perihelion and aphelion, respectively. Planetary embryos are plotted as colored circles, planetesimals with black dots. The color scale represents the fraction of water of the embryos relative to their masses. For this profile there is only one embryo in the HZ, located at 1.13 AU with a mass of 0.37M⊕ and a water content of 2.54% by mass, which represents 34 Earth oceans. The color figure is only available in the electronic version.
Current usage metrics show cumulative count of Article Views (full-text article views including HTML views, PDF and ePub downloads, according to the available data) and Abstracts Views on Vision4Press platform.
Data correspond to usage on the plateform after 2015. The current usage metrics is available 48-96 hours after online publication and is updated daily on week days.
Initial download of the metrics may take a while.