Fig. B.1
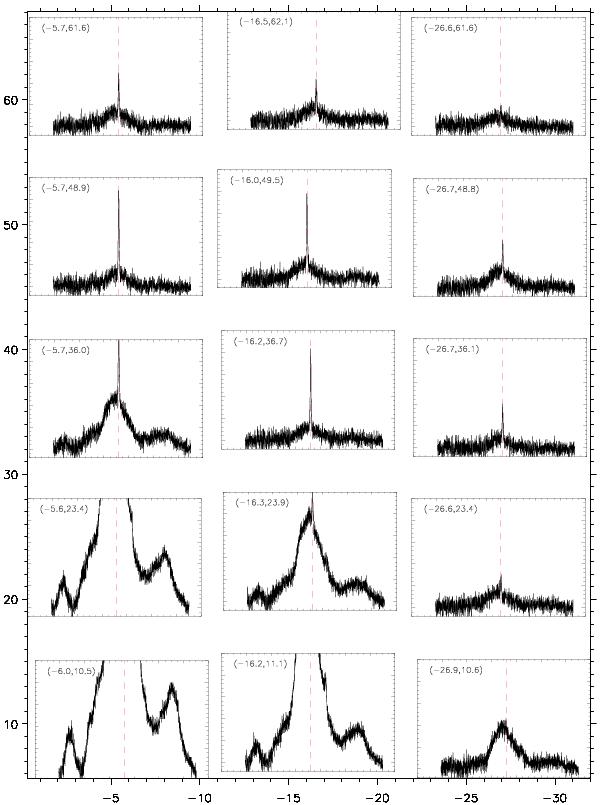
Map of 621 GHz emission corresponding to dataset 2-H in Table A.1. The offsets from (RA[J2000] , Dec[J2000]
 ) are given in the upper left of each panel in seconds of arc. The horizontal and vertical axes bordering the entire set of 15 panels correspond roughly to these respective offsets for the positions at which the spectra shown in the individual panels were observed. The fine vertical scales on the individual panels, run from [− 0.2to2.5] degrees Kelvin; the width of the individual panels cover a Vlsr range of [− 60to80] km s-1 roughly centred on the vertical line marking Vlsr = 12 km s-1, the velocity of the narrow 621 GHz maser feature.
Current usage metrics show cumulative count of Article Views (full-text article views including HTML views, PDF and ePub downloads, according to the available data) and Abstracts Views on Vision4Press platform.
Data correspond to usage on the plateform after 2015. The current usage metrics is available 48-96 hours after online publication and is updated daily on week days.
Initial download of the metrics may take a while.