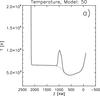
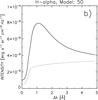
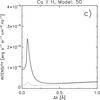
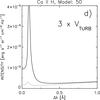
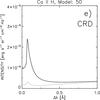
Fig. 8
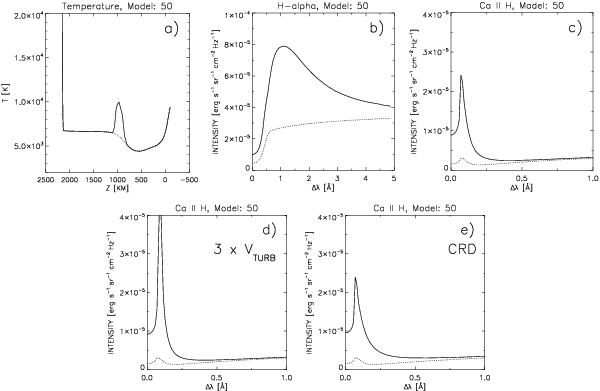
Temperature structure and the theoretical profiles corresponding to model No. 50 of the GRID_1RHO (plots a), b), c)), for which we obtained the best agreement between the theoretical and observed emission of EB_1. Dotted curves show the temperature and line profiles corresponding to C7 model of the quiet Sun. In the lower panel we present the theoretical CaII H line profiles calculated for the same model No. 50 but with three times greater microturbulence in the hot spot region (plot d) and with the CRD (plot e) for standard microturulence taken from C7.
Current usage metrics show cumulative count of Article Views (full-text article views including HTML views, PDF and ePub downloads, according to the available data) and Abstracts Views on Vision4Press platform.
Data correspond to usage on the plateform after 2015. The current usage metrics is available 48-96 hours after online publication and is updated daily on week days.
Initial download of the metrics may take a while.