Fig. 7
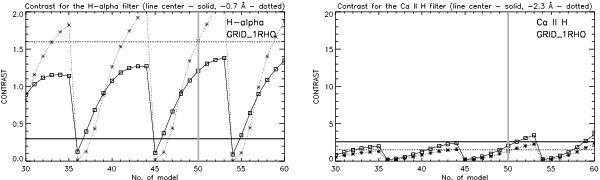
Zoomed plots of the theoretical contrast across the grid GRID_1RHO. These plots include a small range of grid models, where the theoretical Hα and Ca II H contrasts fit best the corresponding observed contrast. The horizontal lines represent the observed contrast for EB_1 at the moment of its maximum brightness derived from the DOT filtergrams. Solid lines correspond to contrast observed in the lines centers, dotted lines denote the contrast observed in the line wings. Thick vertical gray lines correspond to the position of Model No. 50, which fits the observations in the best way.
Current usage metrics show cumulative count of Article Views (full-text article views including HTML views, PDF and ePub downloads, according to the available data) and Abstracts Views on Vision4Press platform.
Data correspond to usage on the plateform after 2015. The current usage metrics is available 48-96 hours after online publication and is updated daily on week days.
Initial download of the metrics may take a while.