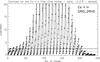
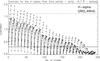
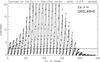
Fig. 6
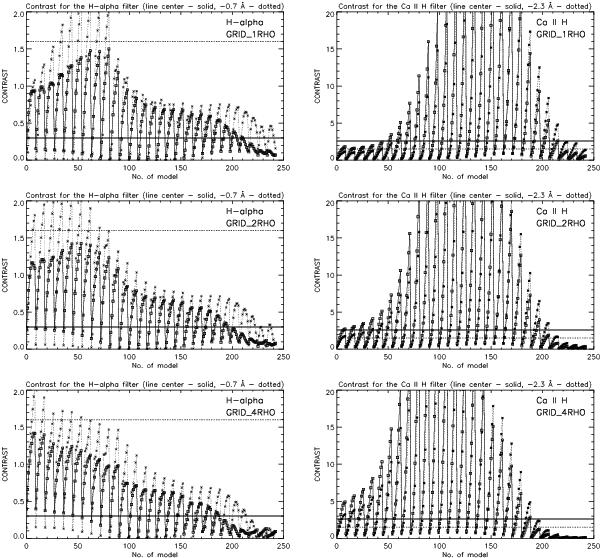
Variations of the theoretical contrast across the grids GRID_1RHO (upper row), GRID_2RHO (middle row), and GRID_4RHO (lower row). The results for the Hα line are presented in the lefthand column plots, for CaII H line in the righthand column plots. In each panel there are curves calculated for the line center (solid lines with squares), and for the line wings Hα–0.7 and CaII H −2.35 Å (dotted lines with stars). The horizontal lines visible in each plot represent the observed contrast for EB_1 at the moment of its maximum brightness derived from DOT filtergrams obtained in the Hα (plots in the left column) and in the CaII H line (plots in the right column). Solid lines correspond to the contrast observed in lines centers, and dotted lines denote the contrast observed in line wings.
Current usage metrics show cumulative count of Article Views (full-text article views including HTML views, PDF and ePub downloads, according to the available data) and Abstracts Views on Vision4Press platform.
Data correspond to usage on the plateform after 2015. The current usage metrics is available 48-96 hours after online publication and is updated daily on week days.
Initial download of the metrics may take a while.