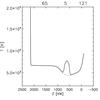
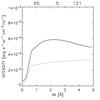
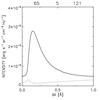
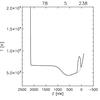
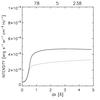
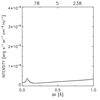
Fig. 4
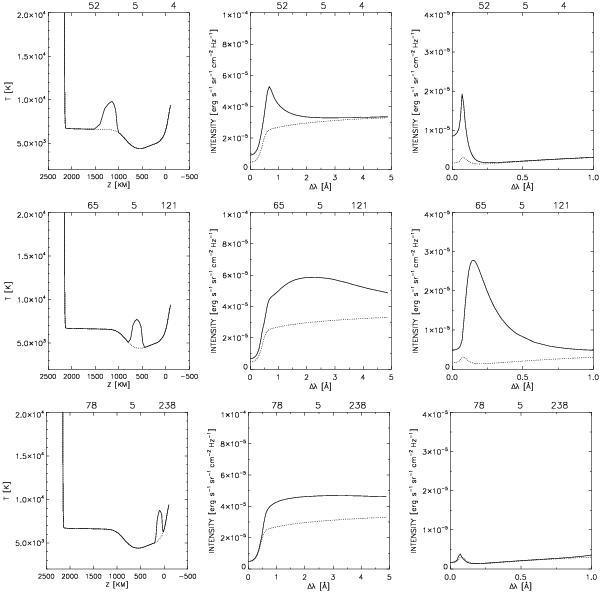
Example of hot spot models of EBs: temperature distribution (left), synthetic Hα line profiles (middle), and CaII H line profiles (right). Dotted lines represent the temperature distribution of the C7 model of the quiet-Sun atmosphere and corresponding line profiles of the quiet Sun. The numbers above the plots denote the specific model numbers. We chose three representative models (4, 121, and 238 in upper, middle, and lower rows) in the beginning, in the middle, and in the end of the grid with the gas-density structure identical to that of C7 (see Sect. 4 for details). In the temperature plots (leftmost column), the heights are above the photosphere defined by τ500 = 1 layer in the solar atmosphere.
Current usage metrics show cumulative count of Article Views (full-text article views including HTML views, PDF and ePub downloads, according to the available data) and Abstracts Views on Vision4Press platform.
Data correspond to usage on the plateform after 2015. The current usage metrics is available 48-96 hours after online publication and is updated daily on week days.
Initial download of the metrics may take a while.