Free Access
Fig. 3
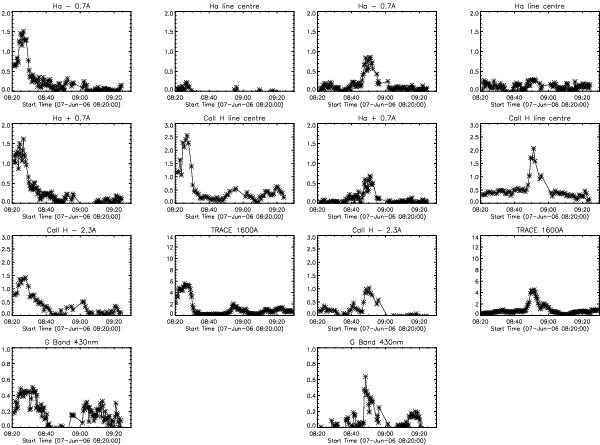
Time evolution of the emission of EBs No. 1 (EB_1, two leftmost columns) and No. 2 (EB_2, two rightmost columns) in the Hα, CaII H, and G-band spectral ranges and in TRACE 1600 Å channel. The vertical axes represent the contrast defined in Eq. (1).
This figure is made of several images, please see below:
Current usage metrics show cumulative count of Article Views (full-text article views including HTML views, PDF and ePub downloads, according to the available data) and Abstracts Views on Vision4Press platform.
Data correspond to usage on the plateform after 2015. The current usage metrics is available 48-96 hours after online publication and is updated daily on week days.
Initial download of the metrics may take a while.