Fig. 7
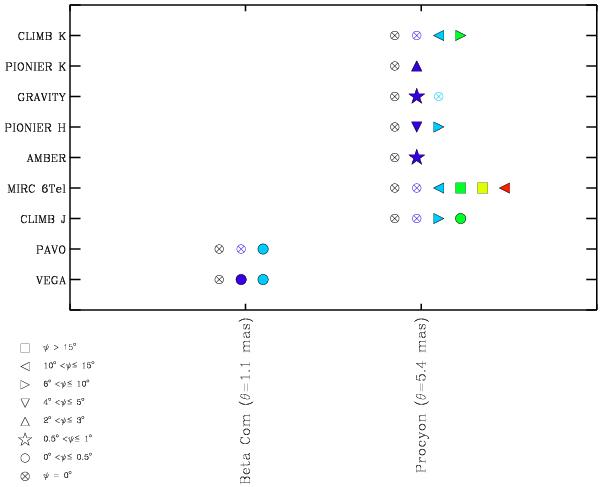
Same as in Fig. 6 but for two real targets: Beta Com and Procyon (see Table 3 for the associated RHD simulation). MATISSE and NPOI do not probe frequencies higher than the first lobe and have not been reported. The sizes of the circles correspond to different values in degrees. The values of ψ are lower than in Fig. 6. The crossed circle means that there are no detected departures.
Current usage metrics show cumulative count of Article Views (full-text article views including HTML views, PDF and ePub downloads, according to the available data) and Abstracts Views on Vision4Press platform.
Data correspond to usage on the plateform after 2015. The current usage metrics is available 48-96 hours after online publication and is updated daily on week days.
Initial download of the metrics may take a while.