Fig. 6
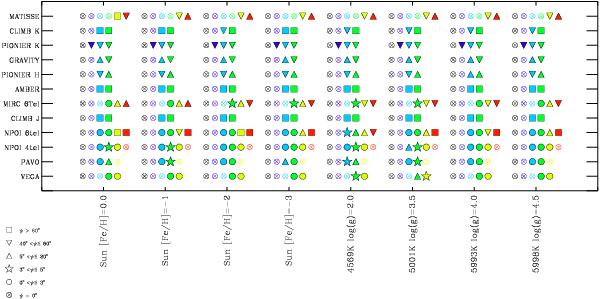
Differences, ψ, between the closure phases and zero or ± π (i.e., departure from axisymmetric case) for all the simulations of Table 1 (horizontal axis) and all the instruments of Table 2 (vertical axis). ψ has been averaged over the spatial frequencies corresponding to the different lobes spanned by the instruments configuration (see text), and for each simulation, 6 lobes are displayed: black for the 1st lobe, violet for the 2nd, light blue for the 3rd, green for the 4th, yellow for the 5th, and red for the 6th. Only the lobes spanned in the UV planes of Fig. 4 are plotted. The symbols correspond to different values, in degrees.
Current usage metrics show cumulative count of Article Views (full-text article views including HTML views, PDF and ePub downloads, according to the available data) and Abstracts Views on Vision4Press platform.
Data correspond to usage on the plateform after 2015. The current usage metrics is available 48-96 hours after online publication and is updated daily on week days.
Initial download of the metrics may take a while.