Fig. 5
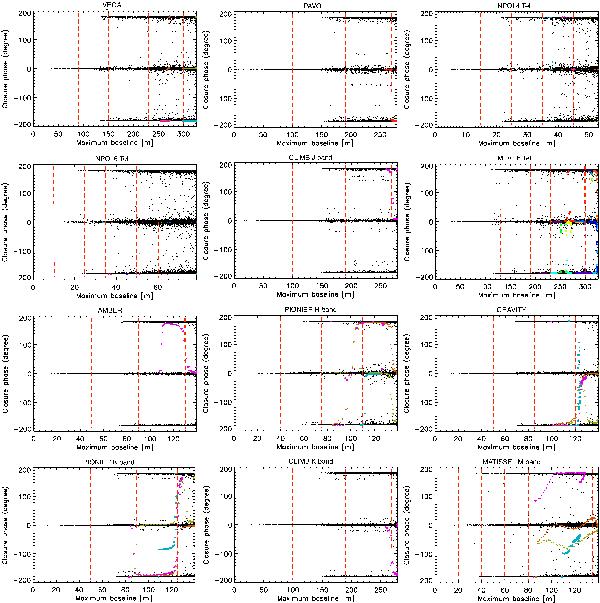
Scatter plot of closure phases of 20 000 random baseline triangles (black dots) as a function of the maximum linear extension corresponding to the configuration chosen for each instrument of Table 2 and for the RHD simulation of the Sun (Table 1). The coloured symbols over-plotted display the closure phases for the configuration chosen (see the UV-planes of Fig. 4), and the vertical dashed red lines give the approximate positions of the different lobes.
Current usage metrics show cumulative count of Article Views (full-text article views including HTML views, PDF and ePub downloads, according to the available data) and Abstracts Views on Vision4Press platform.
Data correspond to usage on the plateform after 2015. The current usage metrics is available 48-96 hours after online publication and is updated daily on week days.
Initial download of the metrics may take a while.