Fig. 11
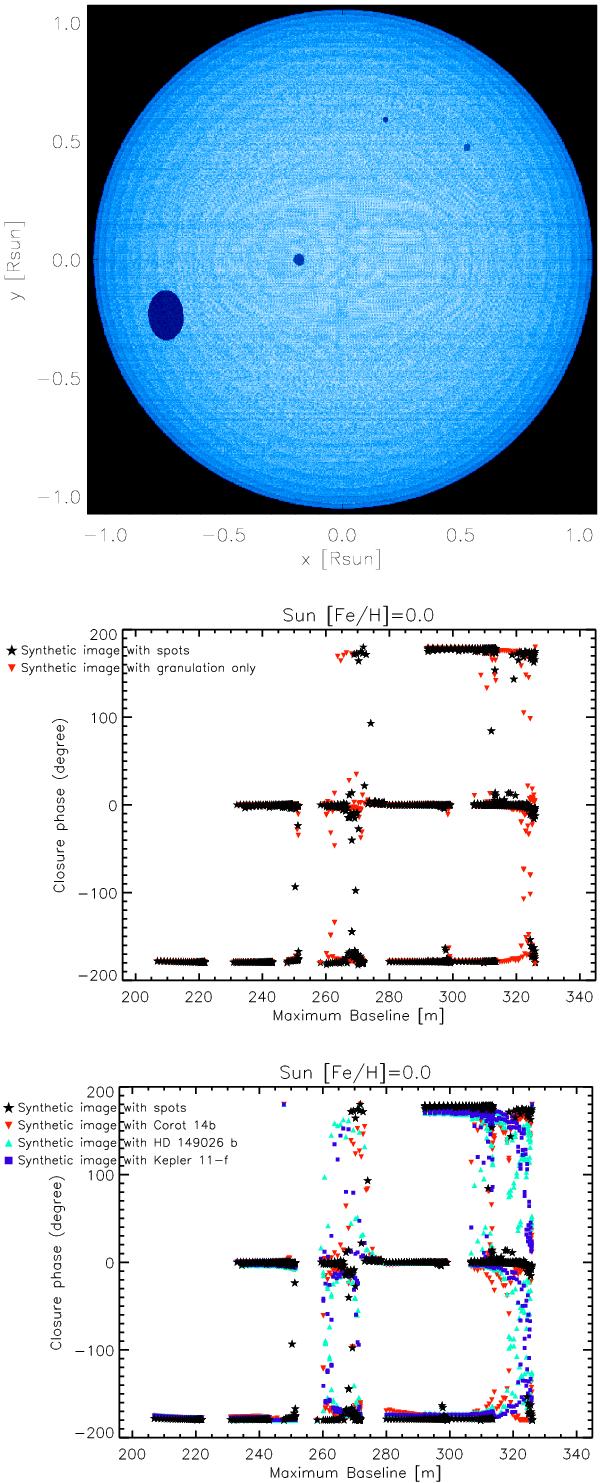
Top panel: synthetic stellar disk image of the Sun (Table 1) for the MIRC instrument with four darker starspots (see text) and parameters reported in Table 6. Central panel: scatter plot of closure phases computed for the Sun with starspots (black stars) and for the Sun (red triangles). Bottom panel: same as in bottom left panel but for the Sun with transiting planets.
Current usage metrics show cumulative count of Article Views (full-text article views including HTML views, PDF and ePub downloads, according to the available data) and Abstracts Views on Vision4Press platform.
Data correspond to usage on the plateform after 2015. The current usage metrics is available 48-96 hours after online publication and is updated daily on week days.
Initial download of the metrics may take a while.