Fig. 2
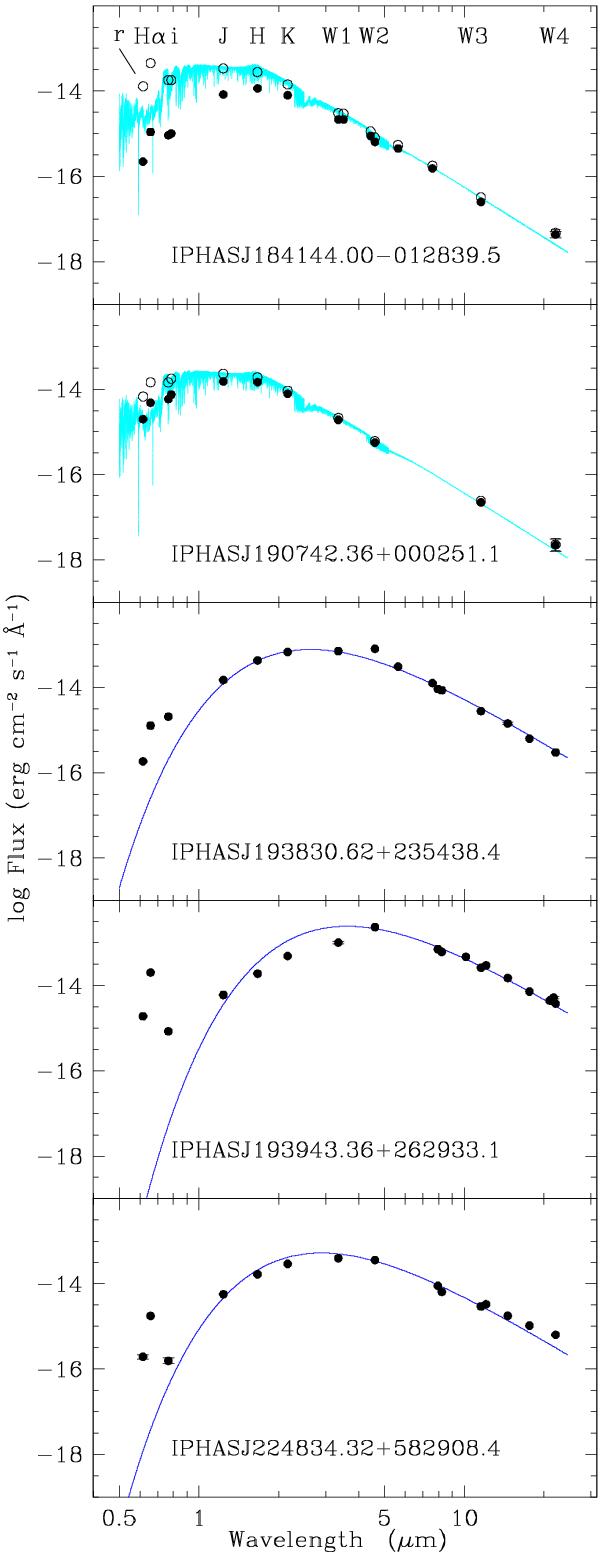
Spectral energy distribution for the two S-type (top two panels) and the three D-type (bottom panels) new symbiotic stars. Filled circles are the observed fluxes from 0.6 to 22 μm, whereas open circles are fluxes dereddened with values of AV determined from the best fit photospheric modelling (cyan line in the S-type objects). Errors are plotted when larger than the size of the symbol. The blue curves represent blackbody fits to the 2.2 → 22 μm data for the D-type symbiotics. See text for details.
Current usage metrics show cumulative count of Article Views (full-text article views including HTML views, PDF and ePub downloads, according to the available data) and Abstracts Views on Vision4Press platform.
Data correspond to usage on the plateform after 2015. The current usage metrics is available 48-96 hours after online publication and is updated daily on week days.
Initial download of the metrics may take a while.