Free Access
Fig. 7
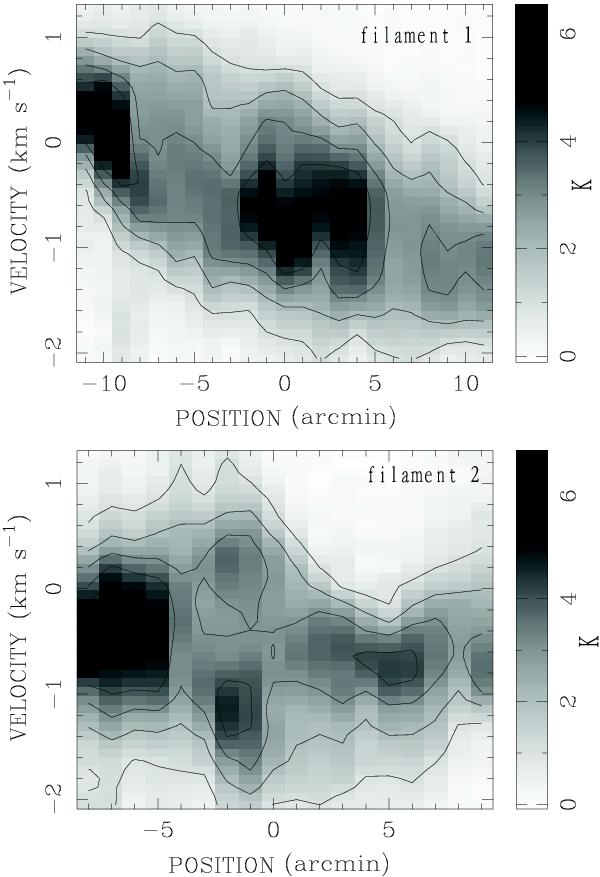
Position–velocity diagrams of the 13CO J = 1 − 0 emission along the two marked straight lines in the left panel of Fig. 2. The contour levels in both panels are 10% to 60% of the peak value spaced with 10% contour interval, successively.
Current usage metrics show cumulative count of Article Views (full-text article views including HTML views, PDF and ePub downloads, according to the available data) and Abstracts Views on Vision4Press platform.
Data correspond to usage on the plateform after 2015. The current usage metrics is available 48-96 hours after online publication and is updated daily on week days.
Initial download of the metrics may take a while.