Fig. 6
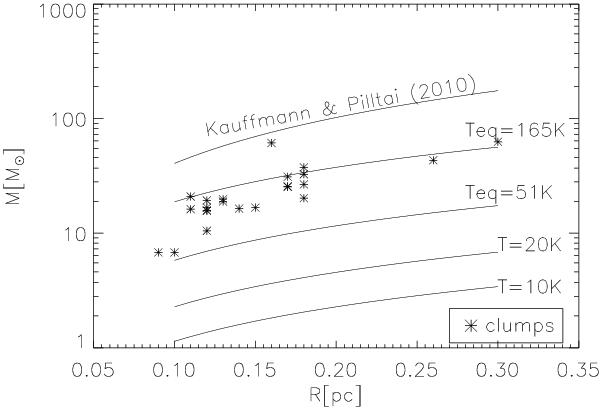
Mass (in units of solar mass M⊙) versus radius (in units of pc) of the molecular clumps in our sample compared with the static Bonnor-Ebert sphere. The top curve (e.g. Kauffmann & Pilltai 2010) represents the mass–radius threshold for forming massive stars. The other curves are the critical masses that can be supported for clumps of specified temperatures and sizes. Teq = 51 K corresponds to a turbulent linewidth of ~1 km s-1 (FWHM), and 165 K corresponds to a linewidth of ~1.8 km s-1.
Current usage metrics show cumulative count of Article Views (full-text article views including HTML views, PDF and ePub downloads, according to the available data) and Abstracts Views on Vision4Press platform.
Data correspond to usage on the plateform after 2015. The current usage metrics is available 48-96 hours after online publication and is updated daily on week days.
Initial download of the metrics may take a while.