Free Access
Fig. 3
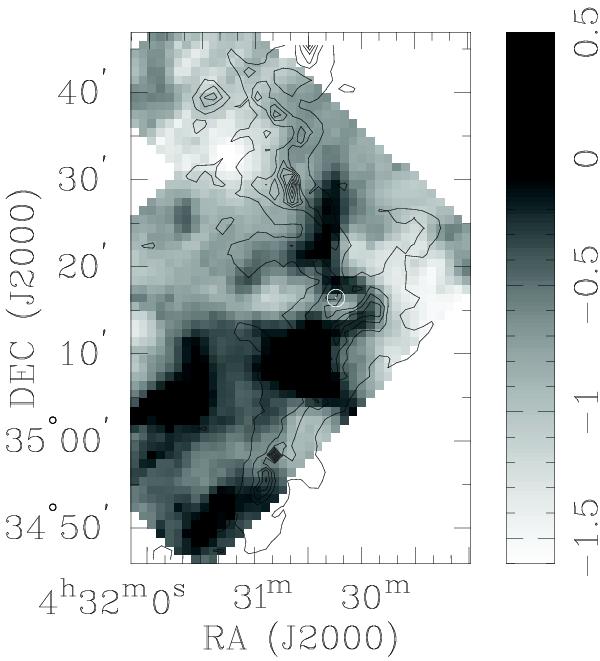
Column density contours (black) are overlaid on the 12CO J = 2 − 1 intensity-weighted velocity maps (first moment). Contours here are plotted from 6.3 × 10²¹ to 5.7 × 10²² with a spacing of 6.3 × 10²¹ (10% to 90% spaced with 10% interval of the maximum). The white circle marks the location of the stellar cluster NGC 1579.
Current usage metrics show cumulative count of Article Views (full-text article views including HTML views, PDF and ePub downloads, according to the available data) and Abstracts Views on Vision4Press platform.
Data correspond to usage on the plateform after 2015. The current usage metrics is available 48-96 hours after online publication and is updated daily on week days.
Initial download of the metrics may take a while.