Fig. 2
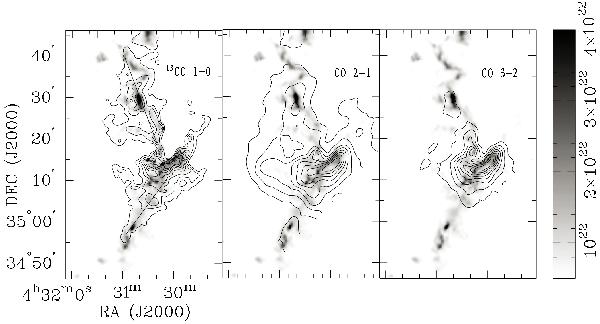
Three molecular line transitions of 13CO J = 1 − 0, 12CO J = 2 − 1 and 12CO J = 3 − 2 shown as integrated molecular intensity maps are overlaid with the column density of hydrogen molecules (H2). The contours are from 20% to 90% of the peak with an adjacent contour interval of 10%. Molecular emissions integrated from −3 km s-1 to 3 km s-1 (from the channel maps in Appendix A). The white circle is the location of the stellar cluster NGC 1579 and the two straight lines in the left panel indicate the loci for the position–velocity diagrams in Fig. 7.
Current usage metrics show cumulative count of Article Views (full-text article views including HTML views, PDF and ePub downloads, according to the available data) and Abstracts Views on Vision4Press platform.
Data correspond to usage on the plateform after 2015. The current usage metrics is available 48-96 hours after online publication and is updated daily on week days.
Initial download of the metrics may take a while.