Fig. 1
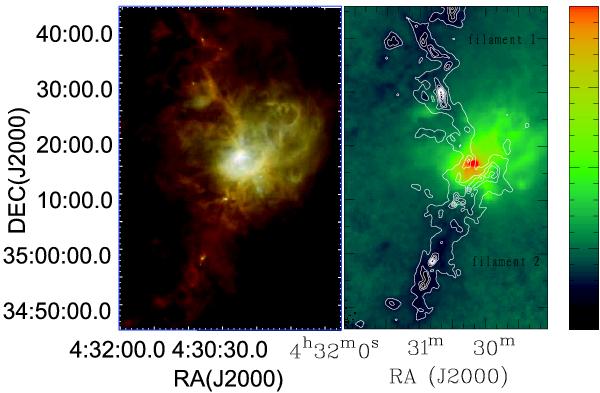
Left panel: three-color image of molecular filament L1482; here, shown in red the 250 μm, green the 160 μm, and blue the 70 μm band (Harvey et al. 2013). The shorter wavelengths reveal hot dusts, such as the H ii regions (Sharpless-222; see Sharpless 1959) around the NGC 1579 stellar cluster, which are clearly shown in blue. The longer wavelengths show the cold, dense objects, such as the cold dense filaments plotted in red. Right panel: dust temperature map (36′′ corresponding to 0.08 pc) of filament L1482, with the column density NH2 of molecular hydrogen contours overlaid. Contours are plotted from 6.3 × 10²¹ to 5.7 × 1022 cm-2 with a spacing of 6.3 × 1021 cm-2 (10% to 90% of the maximum spaced with 10% contour interval).
Current usage metrics show cumulative count of Article Views (full-text article views including HTML views, PDF and ePub downloads, according to the available data) and Abstracts Views on Vision4Press platform.
Data correspond to usage on the plateform after 2015. The current usage metrics is available 48-96 hours after online publication and is updated daily on week days.
Initial download of the metrics may take a while.