Fig. 7
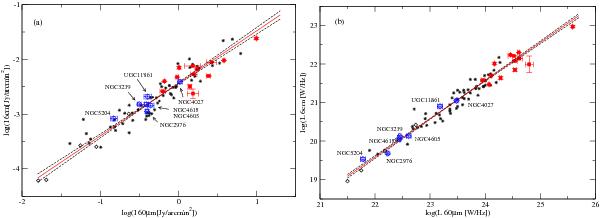
Radio-FIR correlation diagram for our Magellanic-type and peculiar galaxies (diamonds), as well as interacting objects (squares) and bright spiral galaxies (asterisks). The surface brightness a) and luminosity b) at 4.85 GHz (6 cm) and at 60 μm are used, respectively. The solid line is a bisector fit to all galaxies, while the dashed lines represent simple X vs. Y and Y vs. X regressions. Error bars are marked just for a few objects for example’s sake.
Current usage metrics show cumulative count of Article Views (full-text article views including HTML views, PDF and ePub downloads, according to the available data) and Abstracts Views on Vision4Press platform.
Data correspond to usage on the plateform after 2015. The current usage metrics is available 48-96 hours after online publication and is updated daily on week days.
Initial download of the metrics may take a while.