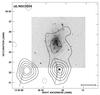
Fig. 2
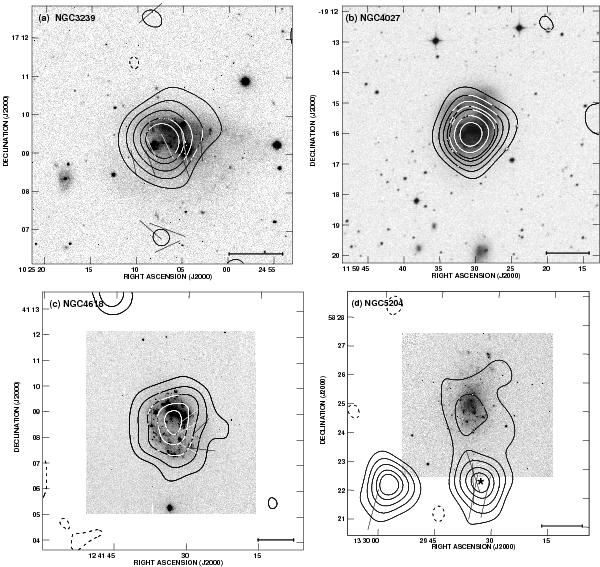
Total-power contours at 8.35 GHz and B-vectors of polarised intensity of NGC 3239 a), NGC 4618 c), NGC 5204 d), superimposed on the Hα images and NGC 4027 b) superimposed on the DSS blue image. The contour levels are as follows: 0.5 a), 0.7 b), 0.3 c), 0.45 d), × (−5, −3, 3, 6, 9, 12, 14, 18, 22) mJy/beam. The map resolution is 1.4′ HPBW, as shown as a horizontal bar at bottom right. For all the images, a vector of 1′ length corresponds to the polarised intensity of 0.3 mJy/beam. The Hα images of NGC 3239 and NGC 5204 are from NED and those for NGC 4618 from Knapen et al. (2004).
Current usage metrics show cumulative count of Article Views (full-text article views including HTML views, PDF and ePub downloads, according to the available data) and Abstracts Views on Vision4Press platform.
Data correspond to usage on the plateform after 2015. The current usage metrics is available 48-96 hours after online publication and is updated daily on week days.
Initial download of the metrics may take a while.