Free Access
Fig. 3
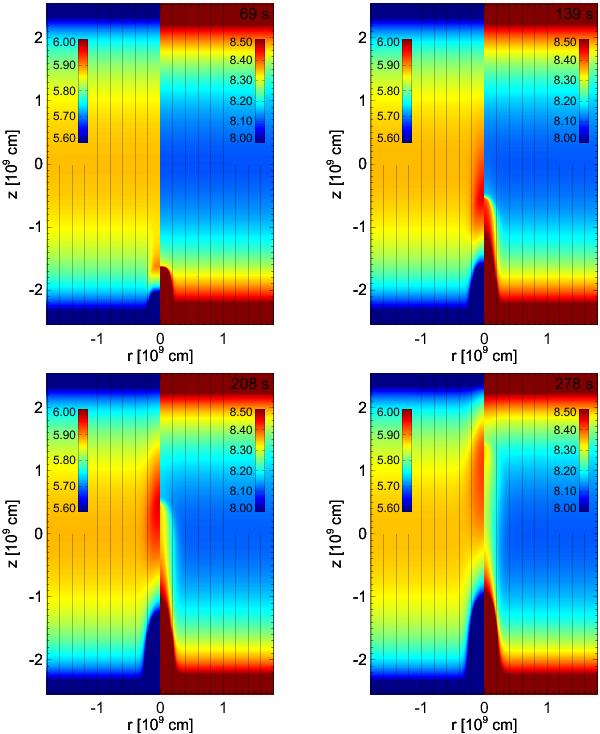
Results of the reference 2D MHD simulation: maps of temperature (left side) and density (right side) in a cross-section of the cylindrical domain at the labelled times (t = 69 s, 139 s, 208 s, 278 s, see online supplementary movie for an animated version of this evolution).
Current usage metrics show cumulative count of Article Views (full-text article views including HTML views, PDF and ePub downloads, according to the available data) and Abstracts Views on Vision4Press platform.
Data correspond to usage on the plateform after 2015. The current usage metrics is available 48-96 hours after online publication and is updated daily on week days.
Initial download of the metrics may take a while.