Fig. 8
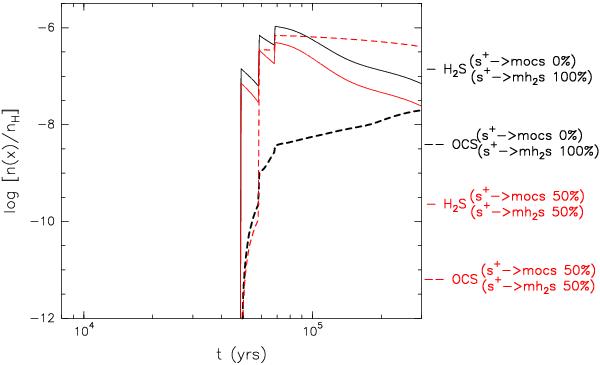
Effect on OCS and H2S abundances (Phase II) of varying the percentage of S+ frozen into H2S and OCS. In black, we show the results when all S+ freezes out to form H2S and in red, when S+ freezes out to form OCS (50%) and H2S (50%) at the end of Phase I.
Current usage metrics show cumulative count of Article Views (full-text article views including HTML views, PDF and ePub downloads, according to the available data) and Abstracts Views on Vision4Press platform.
Data correspond to usage on the plateform after 2015. The current usage metrics is available 48-96 hours after online publication and is updated daily on week days.
Initial download of the metrics may take a while.