Free Access
Fig. 3
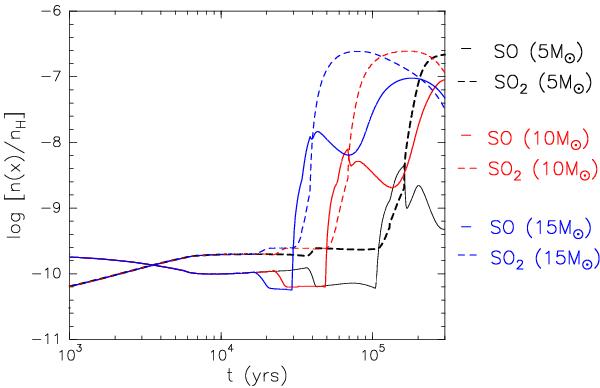
Differences in the SO and SO2 abundance evolution during Phase II for a hot core model when only the star mass is varied. The considered values are 5, 10, and 15 M⊙ drawn in black, red, and blue, respectively.
Current usage metrics show cumulative count of Article Views (full-text article views including HTML views, PDF and ePub downloads, according to the available data) and Abstracts Views on Vision4Press platform.
Data correspond to usage on the plateform after 2015. The current usage metrics is available 48-96 hours after online publication and is updated daily on week days.
Initial download of the metrics may take a while.