Free Access
Fig. 4
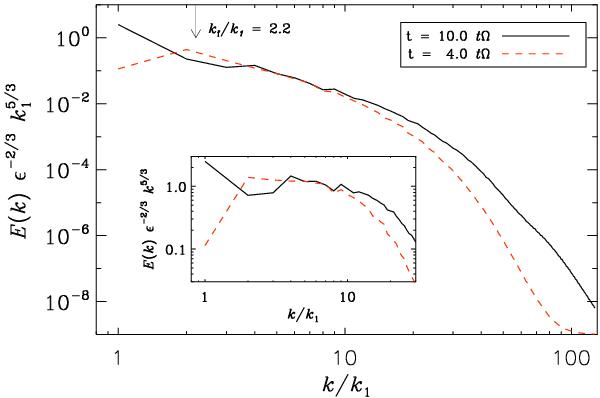
Kinetic energy spectra from Run P5 during both the forcing-dominated plateau (red dashed line) and the linear growth phase (solid line). The inset shows the same energy spectra, but compensated with ϵ− 2/3k5/3.
Current usage metrics show cumulative count of Article Views (full-text article views including HTML views, PDF and ePub downloads, according to the available data) and Abstracts Views on Vision4Press platform.
Data correspond to usage on the plateform after 2015. The current usage metrics is available 48-96 hours after online publication and is updated daily on week days.
Initial download of the metrics may take a while.