Fig. 4
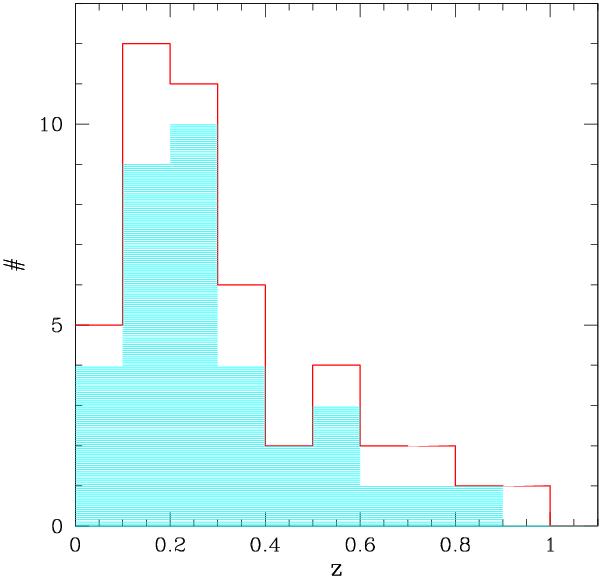
Redshift histogram of the 46 clusters with redshift values with the following priority: i) optical spectroscopic redshift; ii) optical photometric redshift; iii) X-ray spectroscopic redshift. The shaded area corresponds to optical redshifts only (both spectroscopic and photometric).
Current usage metrics show cumulative count of Article Views (full-text article views including HTML views, PDF and ePub downloads, according to the available data) and Abstracts Views on Vision4Press platform.
Data correspond to usage on the plateform after 2015. The current usage metrics is available 48-96 hours after online publication and is updated daily on week days.
Initial download of the metrics may take a while.