Fig. 2
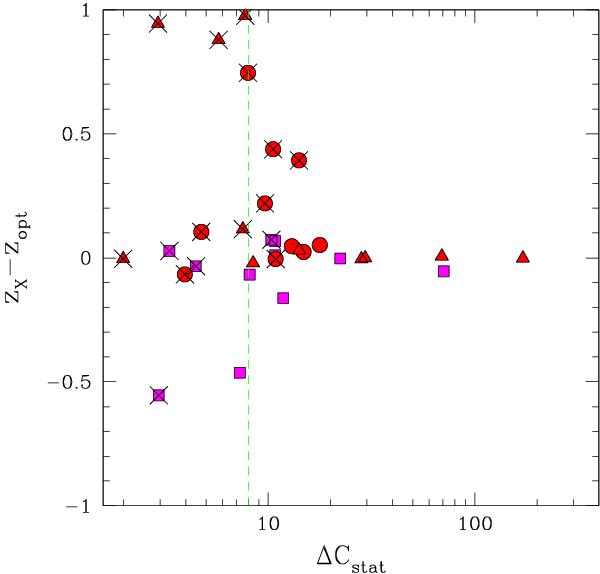
Difference zX − zopt for the 35 sources with spectroscopic or photometric redshift plotted as a function of the ΔCstat value. Red circles (triangles) are for clusters whose photometric (spectroscopic) redshift is found in the literature through a match with the NED, while the magenta squares are for clusters whose photometric redshift has been computed by us with a dedicated TNG program or with VLT archival image (in one case). Crosses corresponds to zX values rejected after a visual inspection because a secondary minimum in Cstat is found close to the minimum (see text for details). Error bars on zX and zopt correspond to 1σ.
Current usage metrics show cumulative count of Article Views (full-text article views including HTML views, PDF and ePub downloads, according to the available data) and Abstracts Views on Vision4Press platform.
Data correspond to usage on the plateform after 2015. The current usage metrics is available 48-96 hours after online publication and is updated daily on week days.
Initial download of the metrics may take a while.