Fig. 14
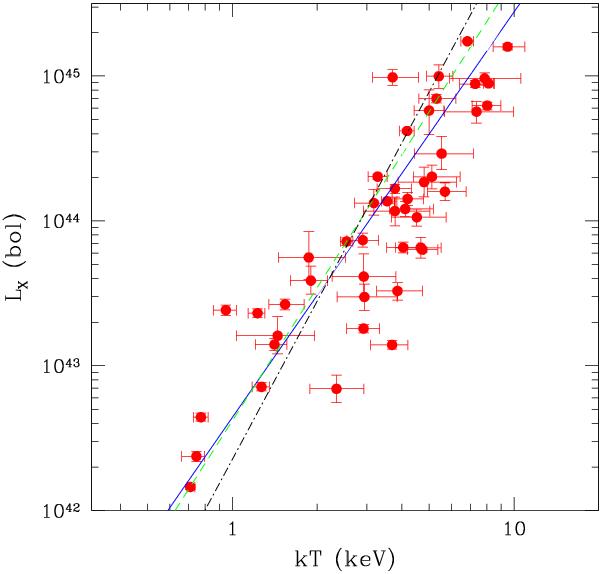
LX − TX relation for the 46 sources with spectral analysis. The solid blue line is the best fit of the LX − TX for our sample. The dashed green line is the best fit for the combined cluster sample analyzed by Branchesi et al. (2007b) computed for ⟨ z ⟩ = 0.25, while the black, dot-dashed line is for the “all cluster” sample presented in Maughan et al. (2012) and computed for ⟨ z ⟩ = 0.25. Luminosities are consistently computed at the estimated radius R500. Error bars correspond to 1σ error both in temperature and luminosity.
Current usage metrics show cumulative count of Article Views (full-text article views including HTML views, PDF and ePub downloads, according to the available data) and Abstracts Views on Vision4Press platform.
Data correspond to usage on the plateform after 2015. The current usage metrics is available 48-96 hours after online publication and is updated daily on week days.
Initial download of the metrics may take a while.