Free Access
Fig. 13
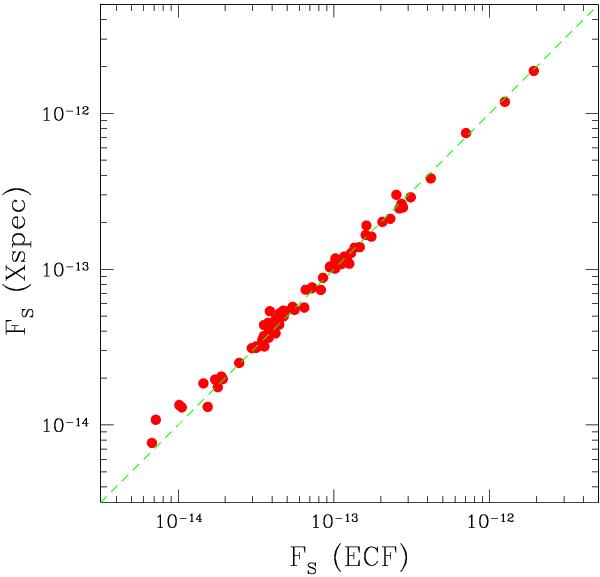
Soft-band fluxes obtained directly from the X-ray spectral analysis, compared to the soft band fluxes measured in Paper I assuming a simple energy conversion factor. Dashed line shows the FS(Xspec) = FS(ECF) relation.
Current usage metrics show cumulative count of Article Views (full-text article views including HTML views, PDF and ePub downloads, according to the available data) and Abstracts Views on Vision4Press platform.
Data correspond to usage on the plateform after 2015. The current usage metrics is available 48-96 hours after online publication and is updated daily on week days.
Initial download of the metrics may take a while.