Fig. 1
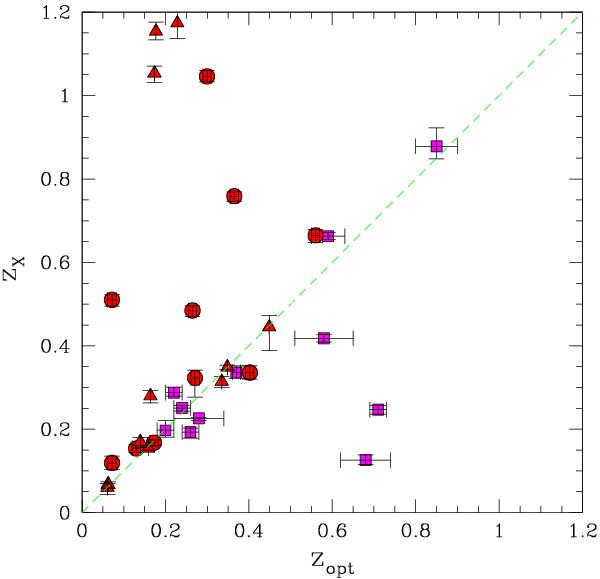
X-ray vs. optical redshift for the 35 sources with spectroscopic or photometric redshift (three sources do not appear since they have zX > 1.2). Red symbols are for clusters whose redshift is found in the literature after inspecting the NED database (circles and triangles are for photometric and spectroscopic redshifts, respectively). Magenta squares are for clusters whose photometric redshift has been computed by us with a dedicated TNG program or with VLT archive images (one case). Error bars on zX and zopt correspond to 1σ.
Current usage metrics show cumulative count of Article Views (full-text article views including HTML views, PDF and ePub downloads, according to the available data) and Abstracts Views on Vision4Press platform.
Data correspond to usage on the plateform after 2015. The current usage metrics is available 48-96 hours after online publication and is updated daily on week days.
Initial download of the metrics may take a while.