Fig. 8
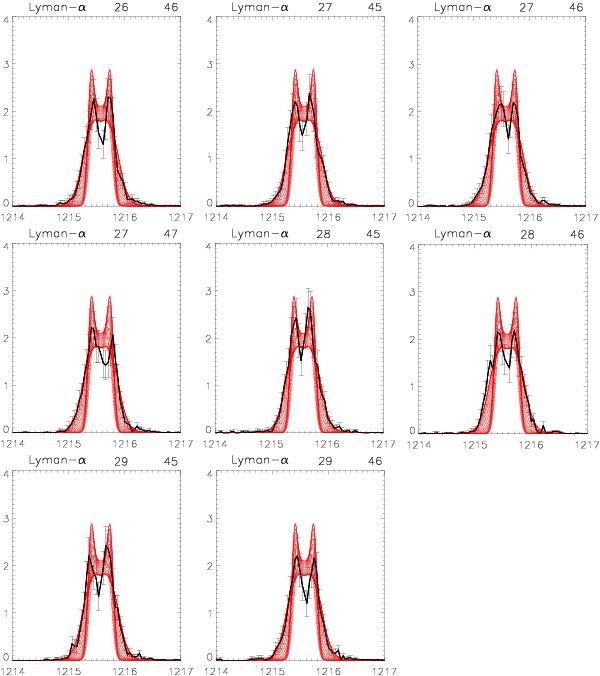
Comparison of the selected observed profiles (black lines with error bars) and the synthetic Lyman-α profiles produced by Model3_6000. We plot the synthetic profiles at 83 positions along the length of the thread. Numbers above each panel indicate the x and y positions in the SOHO/SUMER raster. The x-axis gives the wavelength in Å, the y-axis the specific intensity in 10-8 erg s-1 cm-2 sr-1 Hz-1.
Current usage metrics show cumulative count of Article Views (full-text article views including HTML views, PDF and ePub downloads, according to the available data) and Abstracts Views on Vision4Press platform.
Data correspond to usage on the plateform after 2015. The current usage metrics is available 48-96 hours after online publication and is updated daily on week days.
Initial download of the metrics may take a while.