Fig. 4
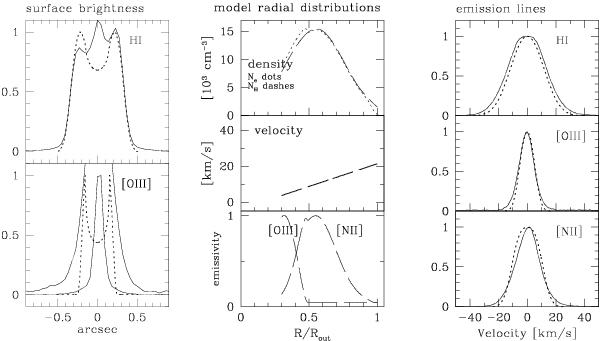
Torun model results for a stellar temperature of 25 200 K and a luminosity of 1400 L⊙. The observed data are drawn in solid lines, while model fits and model parameters are shown as dotted and dashed lines. The “surface brightness” panel (left) shows the slices through the Hα and [O iii] 5007 Å image centre taken along a nebular short axis with the model brightness profile superimposed. Both slices are scaled to unity; however, the [O iii] image is additionally shown with different scaling (see text) because the centre is dominated by the stellar flux. The radial distributions of the best-fit model for selected parameters are shown next. The right-most panel shows the observed and modelled profiles of three nebular lines: Hα, [O iii] 5007 Å, and [N ii] 6584 Å.
Current usage metrics show cumulative count of Article Views (full-text article views including HTML views, PDF and ePub downloads, according to the available data) and Abstracts Views on Vision4Press platform.
Data correspond to usage on the plateform after 2015. The current usage metrics is available 48-96 hours after online publication and is updated daily on week days.
Initial download of the metrics may take a while.