Fig. 5
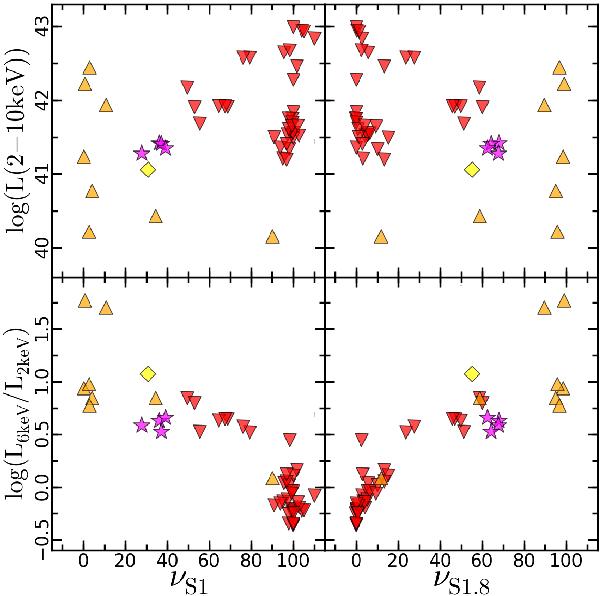
Top: logarithmic of the 2–10 keV band observed luminosity, log(L(2–10 keV)), versus the νS1 (left) and νS1.8 (right) components. Bottom: logarithmic of the ratio between the observed luminosity at 6 keV versus the observed luminosity at 2 keV, log (L6 keV/L2 keV), versus the νS1 (left) and νS1.8 (right) components. We only plot objects with νSB < 10 (see text). The optical classes are shown as: S1 (upside down red triangles), S1.8 (orange triangles), S2 (yellow diamonds), and L1.8 (purple stars).
Current usage metrics show cumulative count of Article Views (full-text article views including HTML views, PDF and ePub downloads, according to the available data) and Abstracts Views on Vision4Press platform.
Data correspond to usage on the plateform after 2015. The current usage metrics is available 48-96 hours after online publication and is updated daily on week days.
Initial download of the metrics may take a while.