Fig. 4
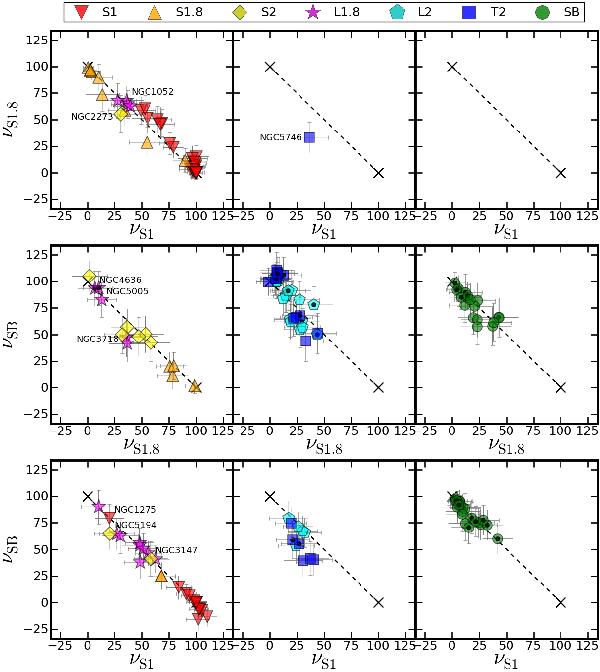
ANN components νS1.8 versus νS1 (top row), νSB versus νS1.8 (middle row), and νSB versus νS1 (bottom row). Each row is split into three panels for the S1, S1.8, S2, and L1.8 classes (left), L2 and T2 classes (middle) and SB class (right). The dashed line shows the expected locus if the component not involved in the plot is negligible. Each plot shows objects that are closer to its dashed line than to the dashed line of the other two plots. The optical classes are shown as S1 (upside down red triangles), S1.8 (orange triangles), S2 (yellow diamonds), L1.8 (purple stars), L2 (light-blue pentagons), T2 (dark-blue squares), SB-AGN (green circles), and SB (green circles with small black dots). Black dots indicate objects that might not be AGN according to the literature (see Table 1).
Current usage metrics show cumulative count of Article Views (full-text article views including HTML views, PDF and ePub downloads, according to the available data) and Abstracts Views on Vision4Press platform.
Data correspond to usage on the plateform after 2015. The current usage metrics is available 48-96 hours after online publication and is updated daily on week days.
Initial download of the metrics may take a while.