Fig. 3
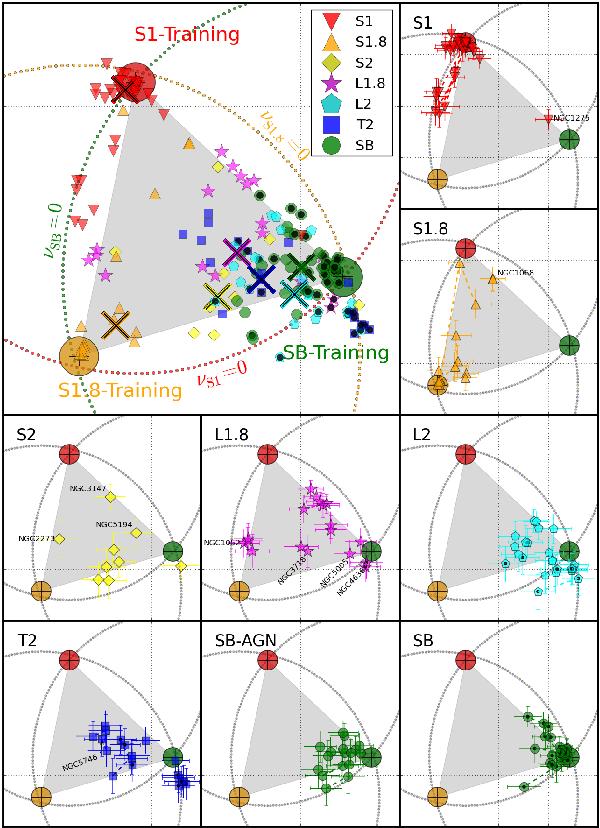
Diagram of the ANN results. The corners of the triangle show the locus expected for S1-training (large red circle), S1.8-training (large orange circle), and SB-training (large green circle). The red, orange, and green dotted circles (centred on the corners of the triangles) correspond to νS1 = 0, νS1.8 = 0, and νSB = 0. The optical classes are shown as S1 (upside down red triangles), S1.8 (orange triangles), S2 (yellow diamonds), L1.8 (purple stars), L2 (light-blue pentagons), T2 (dark-blue squares), SB-AGN (green circles), and SB (green circles with small black dots). Black dots indicate objects that might not be AGN according to the literature (see Table 1). Large crosses represent the mean locus for each optical class. The smaller panels show the diagrams for each optical class. Dashed lines connect observations of the same source. We have marked the names of the relevant objects for Sects. 5.2 and 5.3.
Current usage metrics show cumulative count of Article Views (full-text article views including HTML views, PDF and ePub downloads, according to the available data) and Abstracts Views on Vision4Press platform.
Data correspond to usage on the plateform after 2015. The current usage metrics is available 48-96 hours after online publication and is updated daily on week days.
Initial download of the metrics may take a while.