Fig. 1
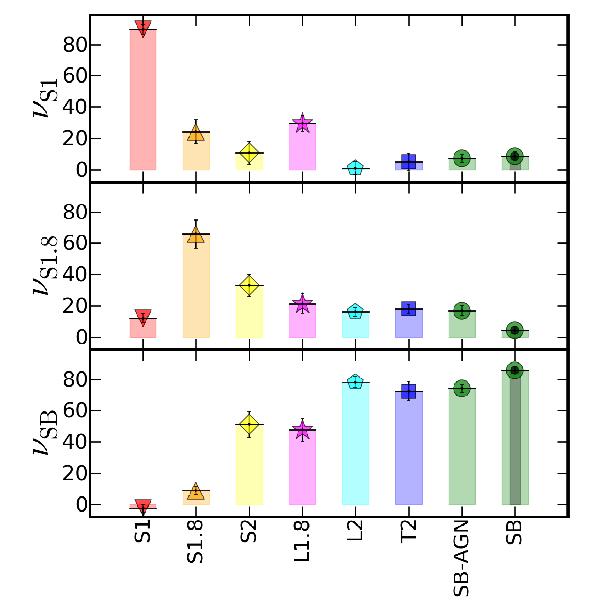
Histogram of the mean value of the ANN components for each optical class. Error bars represent one sigma over the mean for each distribution. The optical classes are shown as: S1 (upside down red triangles), S1.8 (orange triangles), S2 (yellow diamonds), L1.8 (purple stars), L2 (light-blue pentagons), T2 (dark-blue squares), SB-AGN (green circles), and SB (green circles with small black dots).
Current usage metrics show cumulative count of Article Views (full-text article views including HTML views, PDF and ePub downloads, according to the available data) and Abstracts Views on Vision4Press platform.
Data correspond to usage on the plateform after 2015. The current usage metrics is available 48-96 hours after online publication and is updated daily on week days.
Initial download of the metrics may take a while.