Fig. 7
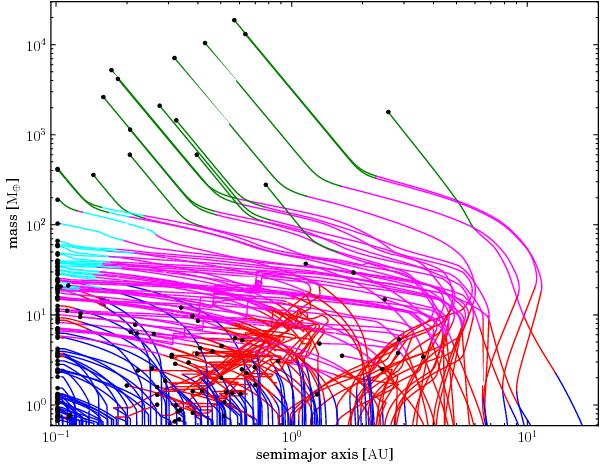
Formation tracks, the evolution of the position of the planets in the semimajor axis mass diagram. Color shows the different migration regimes at this point of its formation. Blue shows unsaturated locally isothermal, cyan saturated locally isothermal migration, red shows unsaturated adiabatic and magenta saturated adiabatic migration, finally, green shows type II migration. The filled circles show the final positions of the planets at the end of the simulations.
Current usage metrics show cumulative count of Article Views (full-text article views including HTML views, PDF and ePub downloads, according to the available data) and Abstracts Views on Vision4Press platform.
Data correspond to usage on the plateform after 2015. The current usage metrics is available 48-96 hours after online publication and is updated daily on week days.
Initial download of the metrics may take a while.