Fig. 6
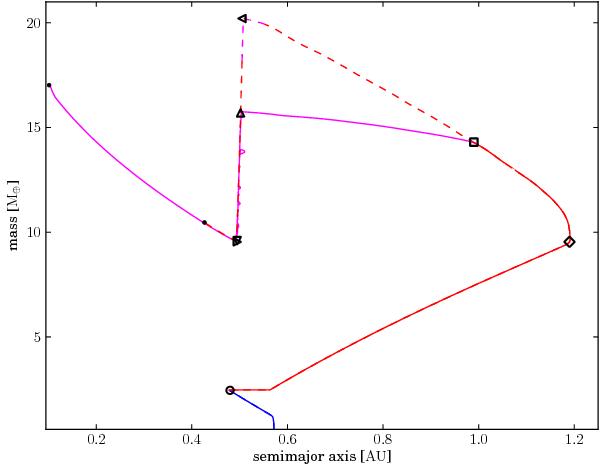
Formation tracks, i.e., evolution of the position in the distance-mass plane for a planet in a nonirradiated, evolving α-disk. The track shown as a solid line uses the BMF migration model, while the dashed line uses the RED model. The colors represent the different migration regimes and are also used in this way in subsequent figures. Blue shows unsaturated locally isothermal migration, while red shows unsaturated adiabatic and magenta saturated adiabatic migration. In both cases the planet does not enter the type II or the saturated locally isothermal regime. The symbols mark the same important points in the evolution as in Fig. 5 and are discussed in the text. The small filled circles show the final positions of the planets at the end of the simulations.
Current usage metrics show cumulative count of Article Views (full-text article views including HTML views, PDF and ePub downloads, according to the available data) and Abstracts Views on Vision4Press platform.
Data correspond to usage on the plateform after 2015. The current usage metrics is available 48-96 hours after online publication and is updated daily on week days.
Initial download of the metrics may take a while.