Fig. 5
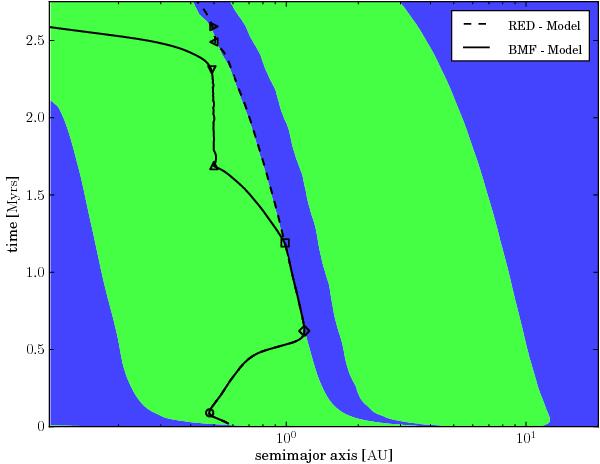
Direction of migration in the adiabatic migration regime for a nonirradiated evolving α-disk. Blue indicates regions of inward migration while green shows outward migration. The black lines are the migration tracks of an evolving protoplanet set into the disk at 2000 yr. The track shown with the solid line uses the BMF migration model while the dashed line is calculated with the RED model (see Sect. 3.4). The symbols mark important points in the evolution and are discussed in the text.
Current usage metrics show cumulative count of Article Views (full-text article views including HTML views, PDF and ePub downloads, according to the available data) and Abstracts Views on Vision4Press platform.
Data correspond to usage on the plateform after 2015. The current usage metrics is available 48-96 hours after online publication and is updated daily on week days.
Initial download of the metrics may take a while.