Fig. 2
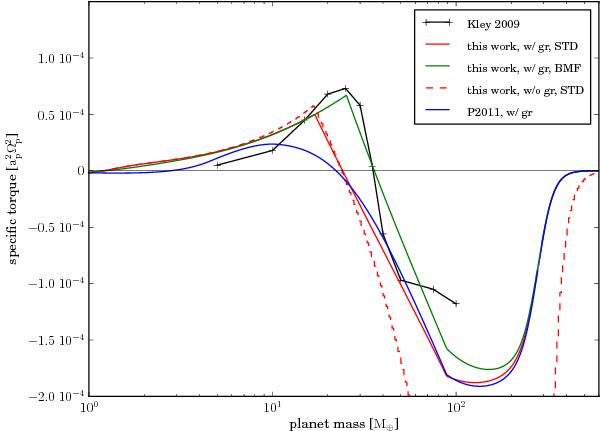
Specific torque for different planet masses in the range from 1 to 600 M⊕ at 5.2 AU. The red solid line shows torques obtained with our nominal case (fvisc = 1.0), the green line is from the BMF model (fvisc = 0.55). The red dashed line does not include the reduction of the surface density due to gap formation (gr), otherwise it is identical to the nominal model. The black line with crosses shows torques from the 3D-radiative hydrodynamic simulations of Kley et al. (2009). A blue line shows torques obtained with the model of Paardekooper et al. (2011). The solid green line is our model of choice for the population synthesis models because it fits the results of full 3D simulations best.
Current usage metrics show cumulative count of Article Views (full-text article views including HTML views, PDF and ePub downloads, according to the available data) and Abstracts Views on Vision4Press platform.
Data correspond to usage on the plateform after 2015. The current usage metrics is available 48-96 hours after online publication and is updated daily on week days.
Initial download of the metrics may take a while.