Fig. 10
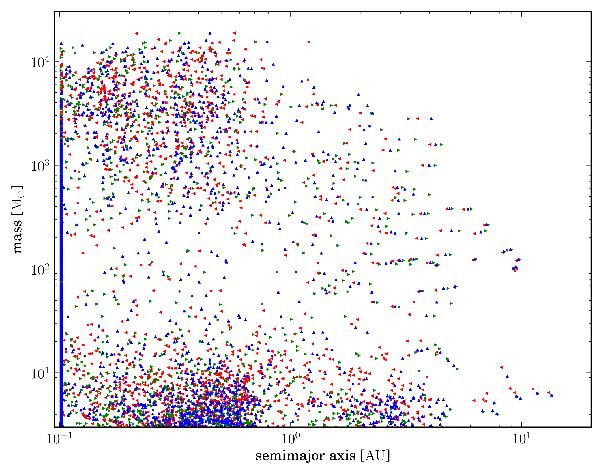
Final position of the planets in the distance-mass diagram. Three different syntheses are shown. Blue, up-facing triangles show the reference synthesis. The other two population calculations are made with the migration model of Paardekooper et al. (2011). Red, left-facing triangles represent planets obtained with this model and the adiabatic coefficient γ calculated by our EOS. Green, right-facing triangles show the a − M positions obtained with the Paardekooper et al. (2011) model with a fixed γ = 1.4.
Current usage metrics show cumulative count of Article Views (full-text article views including HTML views, PDF and ePub downloads, according to the available data) and Abstracts Views on Vision4Press platform.
Data correspond to usage on the plateform after 2015. The current usage metrics is available 48-96 hours after online publication and is updated daily on week days.
Initial download of the metrics may take a while.