Fig. 7
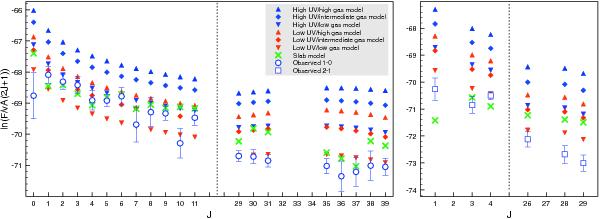
Rotational diagram of CO ro-vibrational lines observed (left: ν = 1 − 0, right: ν = 2 − 1) versus model predicted: slab model described in the text and ProDiMo runs with intermediate PAH abundance, with high, intermediate, and low gas mass, and with high and low UV excess. The vertical dotted lines indicate discontinuity in the x axis.
Current usage metrics show cumulative count of Article Views (full-text article views including HTML views, PDF and ePub downloads, according to the available data) and Abstracts Views on Vision4Press platform.
Data correspond to usage on the plateform after 2015. The current usage metrics is available 48-96 hours after online publication and is updated daily on week days.
Initial download of the metrics may take a while.