Fig. 6
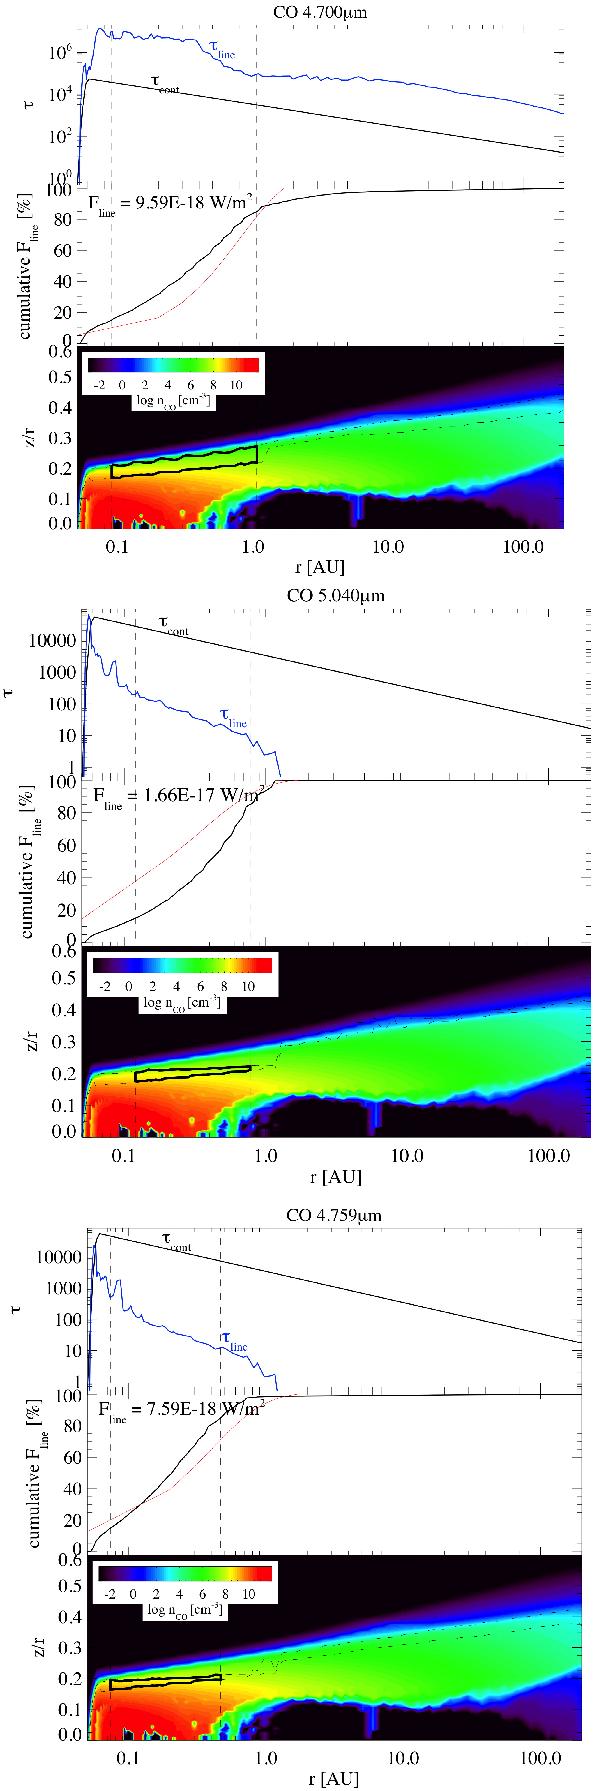
Cumulative flux distribution from vertical escape probability in a ProDiMo model with low UV excess, low gas mass, and low PAH abundance. The top panel of each box shows the vertical optical depth for the line and continuum. The middle panel of each box shows the cumulative flux from the ProDiMo model (black) and best fit slab model (red). The bottom plot of each box shows the CO density distribution in the disk. Outlined with black contours is the region in which radially and vertically between 15 and 85% of the flux originates. The top box is for the ν = 1 − 0 P4 line, the middle box for the ν = 1 − 0 P36 line, the bottom box for the ν = 2 − 1 P4 line.
Current usage metrics show cumulative count of Article Views (full-text article views including HTML views, PDF and ePub downloads, according to the available data) and Abstracts Views on Vision4Press platform.
Data correspond to usage on the plateform after 2015. The current usage metrics is available 48-96 hours after online publication and is updated daily on week days.
Initial download of the metrics may take a while.