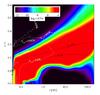
Fig. 5
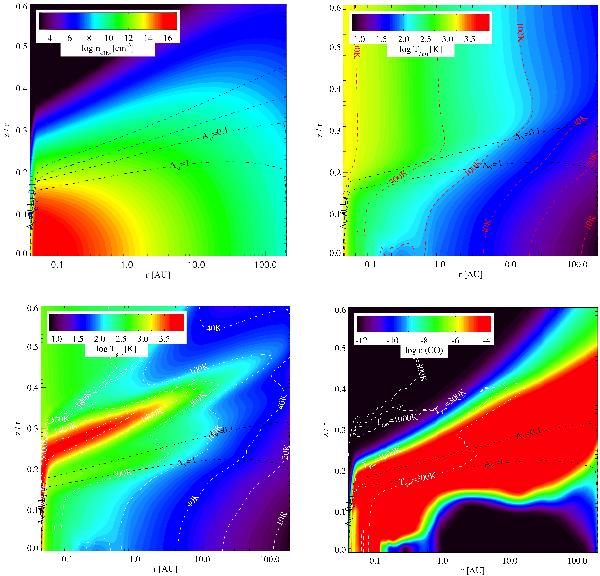
From top to bottom, left to right: total hydrogen number density, dust temperature, gas temperature, and CO abundance distribution in the reference disk model, namely the case with low UV excess, low gas mass, and low PAH abundance. The black contours indicate the total AV = 0.1,1 lines. The white contours indicate the gas temperature, while the red contours in the dust temperature plot indicate dust temperature.
Current usage metrics show cumulative count of Article Views (full-text article views including HTML views, PDF and ePub downloads, according to the available data) and Abstracts Views on Vision4Press platform.
Data correspond to usage on the plateform after 2015. The current usage metrics is available 48-96 hours after online publication and is updated daily on week days.
Initial download of the metrics may take a while.